SINGLE CHANNEL ANALYSIS - FITTING MULTIPLE SIMULTANEOUS GAUSSIAN FUNCTIONS :
PeakFit® is used to deconvolve Ca2+-activated potassium channel amplitude histograms.
|
We are interested in the regulation of large conductance Ca2+-activated potassium channels of CNS origin. We are using single channel recording techniques to study the effects of a variety of signal transduction elements on the activity of these important channels. Regulation of activity can be compared using the open probability - the amount of time the channel(s) are open. Experiments are performed under control conditions and in the presence of the desired bioactive substance in the same patch. When the patch contains only 1 or 2 channels, the determination of open probability is relatively simple. However, there are often 4-8 channels in a given patch. Determination of the open probability requires the deconvolution of an amplitude histogram comprised of multiple Gaussian distributions. There is a unique Gaussian distribution associated with each channel state. In the present example there are 5 channels. Therefore there are 6 Gaussian distributions in the amplitude histogram; all channels closed (level 0 on the activity records), 1 channel open (level 1), 2 channels open (level 2), 3 channels open (level 3), 4 channels open (level 4) and 5 channels open (level 5). Often there is significant overlap between distributions and if the time spent with all channels open is small (in this example all channels are open approximately 1% of the time) it is difficult to solve for this distribution.
The excised patch configuration of the patch-clamp technique was used for data acquisition. Electrodes were fabricated in two steps and were fire polished to a final tip resistance between 3.0 and 5M . Recordings were performed at room temperature with a patch clamp amplifier. The recordings in this example were conducted with the patch depolarized to +20 mV. Single channel data were stored initially on digital audiotape.
Single channel data were digitized at a sampling rate of 2 kHz and filtered at 1 kHz using a 4-pole low pass Bessel filter. Each data file contains approximately 100,000 events. Amplitude histograms are constructed from the digitized single channel data using commercially available software. Single channel records and the amplitude histogram data were exported to SigmaPlot and PeakFit as ASCII files. Line plots were created in SigmaPlot for the desired number of activity records (3 in the present example) and annotated as desired.
|
| |
A vbar graph was created for the amplitude histogram data. The activity records and amplitude histogram were visually inspected to determine the most likely number of distributions contained in the data. |
|

Click to View Larger Image |

Click to View Larger Image |
| |
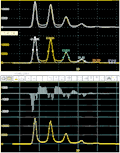
The amplitude histogram was imported into PeakFit and fitted using a sum of Gaussian distribution functions. PeakFit Method 1. was selected for analysis and several hidden peaks were found. These arise from the overlap in distributions and were removed to give a function with 6 Gaussian peaks. |
| |
The data were then fit automatically. Estimates for individual peak areas, means and standard deviations were obtained from the peak fit results. |
| |
Equation 1. was used to calculate the open probability times the number of channels (NP0). i is the number of open channels, N is the total number of channels in the patch and Ai is the area associated with each channel state as determined from the curve-fit individual peak areas. The open probability (P0) was then calculated as NP0/N. |

|
| |
In the present example, NP0= 1.11 and P0=0.22.
Author : Donald D. Denson, Ph.D., Department of Anesthesiology, Emory University School of Medicine. |